Creating an ODI (Oracle Data Integrator)
Dashboard with OBIEE
One
of our clients needed a simple way to view ETL success and failures statistics
in an easy to navigate monitoring tool. The ODI Operator is great for technical
users who have ODI installed but can be complex for business users. Operator
can also become slow due to the large number of interfaces that run each night.
Exposing the ODI work schema to OBIEE was a logical solution to this problem.
We used OBIEE as a way to report and graph ODI ETL executions.
It
is also worth noting that having good naming conventions can really help with
navigating the ETL repository. For example all of our interfaces are prefixed
with INF_%, and Packages with PKG_%. We also have naming conventions
for loading Staging, Dimensions, and Facts, etc.
Below
are the steps to bring ODI ETL statistics into OBIEE
Metadata
- Connect to ODI Work Repository to an OBIEE Subject Area and Expose SNP_STEP_REPORT and SNP_EXP_TXT tables to metadata.
Once the physical schema is brought in you will want to rename the columns to something more meaningful. The only column that needs further definition is the decode statement for STEP_STATUS (Status). These can also be found in the ODI Documentation Substitution Methods Reference.
‘D’ =
Success’
‘E’ =
‘Error’
‘Q’ =
‘Queued’
‘W’ =
‘Waiting’
‘M’ = ‘Warning’
Join
SNP_STEP_REPORT and SNP_EXP_TEXT on
I_TXT_STEP_MESS = I_TXT. This is the join for the error message text and will
display the corresponding error message with the user clicks on the error id.
Dashboard
We
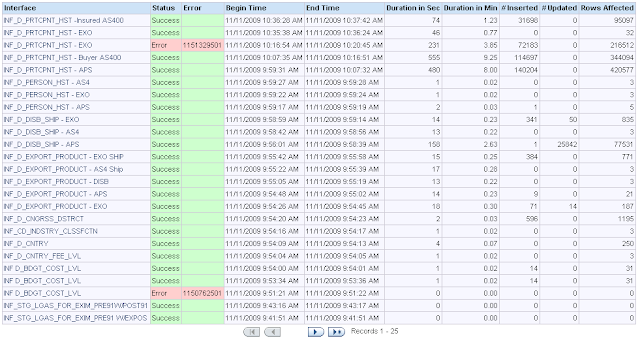
created a dashboard for our client with the following elements.
- Last ETL Run date
- Past 5 Days execution time
- Number of Errors
- Past 24 hour execution log
Reports
Past
5 Days Execution Time
(in Hours) – High level ETL execution time.
- Sum Duration / 3600 and group by date.
All
Executions in Past 24 Hours (with drill-through)
- View every scenario that ran in the past 24 hours.
- Conditional Formatting
- WHEN Status = Success then Green Background
- WHEN Status
- Success then Red Background
- Drill Through
- Interface name to display all executions for this Interface – Drills to All Executions Per Interface
- Error ID to display any error message for this interface – Drills to Interfaces Error Message
All
executions per Interface
- This is used so you can see all the executions over its life for a specific scenario, particularly useful to compare with previous runtimes.
- Drills from Past 24 hour log based on scenario name
Interfaces
Error Message
- View error message when status is “Error” and background is Red
- Drills from Past 24 hour log based on error message text id
Number
of Errors
- Stoplight to display error counts
- SUM(CASE WHEN Status = ‘E’ THEN 1 ELSE 0 END) Group by Date
- Result Type = Gauge and Gauge Type = Bulb.
Displaying
Last ETL Run Time
- MAX( CASE WHEN Status= ‘D’ Then End_Time) and Scenario Name is equal to / is in [your last ETL step]
- Set a Narrative Text


Hello, Thank you for this. I want to build an ODI dashboard but I have a problem. I have no data in this select * from SNP_EXP_TXT.
ReplyDeleteI have data in select * from SNP_STEP_REPORT;
Do you have any idea ?
Eric
I am the owner of this content. Please remove of your blog as you took it without permission.
ReplyDelete