


Logical Dimension
Hierarchies
Dimensions are key to
navigating the business intelligence system that means dimensions define the
axis of investigation of a fact and hierarchy is
a set of parent-child relationships between attributes within a dimension and key
to navigating dimensions.
In OBIEE Logical
dimension hierarchy plays a very important role to calculate useful measures
and allows users to drill down for more
details.
Logical dimension
hierarchies are categories of attributes by which the business is defined.
Periods, products, markets, customers are very common dimensions in business
model.
Dimension is mainly
about “View By”, “Group by”, and “Filter By”.
Each level has at least
one logical key, the top level is marked as the “grand total” level, and you
can drag other attributes in to each level and have OBI EE display those,
rather than the level key, when users drill down in reports.
First of all Update All Rows Counts -> check how many rows in every table and last updated
state. This will help you to define level number
of members at this level for each level of all the hierarchies.

1. Now first step is to create a
logical dimension hierarchy, create a logical dimension object. There are two
methods to create logical dimension objects.
Method 1 :- Right Click on the Business model
in BMM layer select New Object -> Logical Dimension -> Dimension with
Level Based Hierarchy.(Here structure is selected as Time because it’s a time
dimension for other dimension hierarchies don’t select Time as structure )

Method 2 :- Right Click on a logical dimension
table and select Create Dimension -> Dimension with Level-Based Hierarchy,
this will create a dimension hierarchy for the selected dimension table.

2. Start to add a logical level which is highest level of
hierarchy. Right click on the logical dimension and select New Object ->
Logical level.

3. Give a name to this level -> select Grand Total Level,
basically the first level should be grand total level. (Selecting the Grand total level check box is to
indicate that this is the grand total level of this hierarchy).

4. Now add a child level to dimension hierarchy.
Right-click on the Parent level (Total) and select New Object ->
Child Level.

Give a name for the level and enter
the Number of levels at this level.
Now you need
to identify the number of elements for each level. The number of elements
represents the distinct count of rows for each level and is used by Oracle BI
Server to determine the most efficient way to access data when picking
aggregate sources. The number does not have to be exact, but ratios of numbers
from one level to another should be accurate and you want to enter a larger
number for child levels in respect to parent levels.
Enter number
of elements at this level from updated all row counts and enter value that how
many rows year column contains.

5. Similarly add more child levels
below this level as shown in below screen shot.

6. Create
Level Keys : - Level keys
define the unique elements in each level and provide the context for drill
down. Each level needs to have one or more attributes that compose a level key.
The level key defines the unique elements in each level and provides the
context for drill down.
A level may
have more than one level key. When that is the case, you need to specify which
key is the primary key of that level. All dimension sources that have aggregate
content at a specified level need to contain the column that is the primary key
of that level.
To create Level keys drag a logical
column which could be the key for that level.

7. Double-click a level to
open the level properties window -> Click the Keys tab and enter key name
-> click on the primary keys dropdown select the key name to enable the edit
and delete button.
Then click on
edit button to open the logical key dialog box for this level. Select a column
form columns to create a key column for this level and select use for display
-> click ok.

8. Check out the changes and assigned key at the level -> click ok. The color of level key icon will change and also select check box Use for Display.

10.
Set the Preferred Drill Path(Optional) : - You
can use the Preferred Drill Path tab to identify the drill path to use when
Oracle BI Presentation Services users drill down in their data requests. You
should use this only to specify a drill path that is outside the normal drill
path defined by the dimensional level hierarchy. It is most commonly used to
drill from one dimension to another. You can delete a logical level from a
drill path or reorder a logical level in the drill path.
To
set a preferred drill path for dimension levels Open the properties of the
level and select the Preferred Drill Path tab and press ADD button
which open the Browse dialog box, where you can select the logical levels to
include in the drill path. You can select logical levels from the current
dimension or from other dimensions.

Check
the proffered drill path.

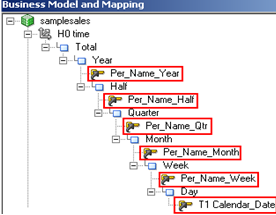
11. Create Presentation Hierarchies
To create hierarchies in
presentation layer follow below methods
Method 1 :- If presentation tables are
already exists in Presentation layer. Drag and drop logical dimension hierarchy
into previously creates dimension table to which this hierarchy belongs. Will
create a presentation hierarchy automatically.(Such as drag time dimension
hierarchy into D0 Time presentation table).
1.1) Presentation Table without
Presentation hierarchy.

1.2) Drag and drop logical dimension
hierarchy from BMM layer into presentation table of Presentation layer.

Method 2 :- If Presentation tables are not
exits into presentation layer, Drag and drop the Dimension table from BMM layer
into Presentation layer, will create a presentation table, columns with
presentation hierarchy automatically.

Method 3 :- Create Presentation Hierarchy
manually
Right click on presentation table
for which you want to create a presentation hierarchy.
3.1) Select New Object ->
Presentation Hierarchy.

3.2) Give a name into Name field in
presentation hierarchy window and click on browse button.

3.3) select a logical dimension hierarchy
from BMM layer.

3.4) after that a new presentation layer
hierarchy will get created without ant level.

3.5) Now create levels for presentation
hierarchy.
Right click on hierarchy icon ->
Select New presentation level.

3.6) Give name of level and browse to
assign level from BMM layer.

3.7) Similarly create or add other levels
of presentation layer hierarchy following above steps.

12) Testing Hierarchy into
presentation layer (answers)
12.1) Create a request select columns
(Year and a measure) from left pane.
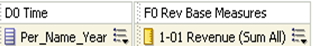
12.2) Click on result tab to see result.
You will get Revenue by year.

12.3) Now click on any value (data) for
column (Per_Name_Year) of dimension table and check the result, drill down is
available now and you can see detail result for a specific year which is the
top level of hierarchy.

12.4) Click on next levels values to go
for more detail result, you can drill down till low level of hierarchy.

12.5)

12.6)

12.7)

13. Create
Level Based Measures
As per a
business requirement need to calculate Total Revenue, Yearly Revenue, Quarterly
Revenue etc, at different levels of dimension and these measure were used
later to create shared measure.
13.1) To create a
level based measures create a logical column in BMM layer in Fact table and map
it from an existing logical column.

13.2) Select a
level from Time Dimension Hierarchy to set it for measure.

13.3) Click ok.

13.4) Check the measure
in BMM layer under FACT table.

13.5) Now add this
level based measure into dimension hierarchy, drag and drop the measure or copy
and paste into under the dimension hierarchy.

Following the
above steps you can create more level based measures, and no need to repeat the
total calculations like Total Revenue, if the basis is same for different
levels, because measure is calculated automatically at run time to the
appropriate level. If the calculation for a level is different from that of another
level need to be have a separate measure or logical column.
14) Creating
Share Measure :- Share measures
are calculated by taking some measure and divide it by a level based measure to
calculate percentage.
14.1) Create a
logical column -> Go to expression builder -> Select Functions
-> Mathematical Functions -> Select Round function.
14.2) Select digits
and enter a value, select Source Number to create a formula as shown below.

15) Add all these
newly created measures to the presentation layer and create a request.

16) Compare
result for all selected column how these columns are showing result.
16.1) Check result
and verify with the data , that values in the columns are desired or not.
Here Total
Revenue is calculating Total Revenue overall and show same data at each level
of dimension hierarchy but the share (always show round off data) and revenue
sum all will get change.

16.2)

16.3)


18) Click on
result and check the hierarchy and measure value.
Result will
appear in a pivot table view

18.1) Result for Total, click on + plus sign for Total, it will generate result for year.

18.2) Similarly
process result for deep child level (Quarter level)

18.3) Month Level

This is a good explanation - especially the tast part on how to combine your facts to the dijmensions. But ... the backgoud image of this blog make readin a pain - to say the least.
ReplyDeleteYou need to copy the contents to a document application to read it!