To add data from another data
source to a data source already in use in a Tableau workbook. This example
starts with a workbook using data from Microsoft Excel, and then adds data
from Microsoft Access. The key to adding data is creating a calculated
field that represents the added source, and using it in the view.
Note : The dimensions used in the view must be present in both data
sources and contain the same values. If blending with a cube data source,
it is only valid as the primary data source.
|
Set up the initial workbook
Step 1
Open a new workbook and connect
to the Superstore sample.
Step 2
From the Dimensions pane,
drag Order Date to the Columns shelf.
Step 3
On the Columns shelf,
right-click Order Date and select Show Quick Filter.
Step 4
In the quick filter, click the
check box for All to clear all the selections, and then select 2009.
Step 5
On the Columns shelf,
click the plus sign on YEAR(Order Date). QUARTER(Order Date) appears
on the Columns shelf next to YEAR(Order Date).
Step 6
Drag QUARTER(Order Date)
to the Rows shelf.
Step 7
From the Dimensions pane,
drag Category to the Columns shelf.
Step 8
From the Measures pane,
drag Sales to the Text shelf on the Marks card. Now
the view for Superstore by itself is complete.
Step 9
Select Data > Connect
to Data and connect to a second data source. For more detailed
information, refer to the "How to Connect to a Data Source"
section of the Online Help.
|
Create relationships to blend the
data
Step 1
In the Data window,
select the second data source.
In the example, notice the link
icon in the Dimensions pane next to Order Date. This icon indicates that
Tableau has automatically created a relationship between Order Date in the
second data source and Order Date in the primary data source. The
relationship was created automatically because the dimensions have the same
name in both data sources.
Every dimension used in the view
must have a relationship with its counterpart in the other data sources. In
this example, Category field in Superstore needs a relationship with
Product Type field in the secondary data source. Tableau did not create an
automatic relationship because the names are different, so you need to
create a custom relationship.
Step 2
In the Data window,
select Superstore.
Step 3
For Tableau Desktop 7.0 and
later, select Data > Edit Relationships.
For Tableau Desktop 6.1 and earlier, in the Data window, right-click
Superstore and select Relationships.
In the Relationships dialog box,
you can see that Tableau has created many automatic relationships. The
automatic relationship does not include Category in the secondary data
source source to Category in Superstore.
Step 4
In the Relationships
dialog box, select Custom, and then click Add.
Step 5
In the Add/Edit Field Mapping
dialog box, in the Primary data source field list, select
Category.
Step 6
In the Secondary data source
field list, select Product Type, and click OK.
In the Relationships dialog box,
the custom relationship has been added to the list.
Step 7
Click OK.
If you select the secondary data
source in the Data window, you see that a link icon now appears next to
Product Type.
|
Create calculated fields to
distinguish and combine sales data
You need to create a calculated
field for sales from the secondary data source and one for the combined
total. In this example, the secondary data source is Sample - Coffee Chain
(Access).
Step 1
In the Data window,
select Superstore.
Step 2
Select Analysis > Create
Calculated Field.
Step 3
In the Calculated Field
dialog box, make the following selections to create this formula:
ZN(SUM([Sample - Coffee Chain
(Access)].[Sales]) )
- In the Name text
box, type Sales - Coffee Chain.
- Click the Formula
text box.
- In the Functions
list, double-click ZN.
- In the Fields
drop-down list, select Sample - Coffee Chain (Access).
- In the Fields list,
double-click Sales.
When finished, click OK.
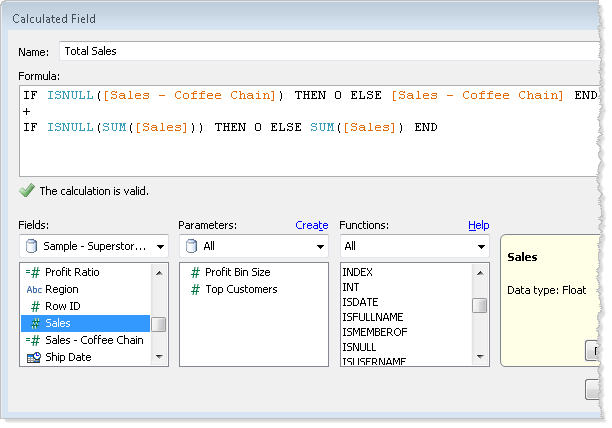
Now create a calculated field
for the Total Sales.
Step 5
Select Analysis > Create
Calculated Field.
Step 6
In the Calculated Field
dialog box, make the following selections to create this formula:
IF ISNULL([Sales - Coffee
Chain]) THEN 0 ELSE [Sales - Coffee Chain] END
+
IF ISNULL(SUM([Sales])) THEN 0 ELSE SUM([Sales]) END
- In the Name text
box, type Total Sales.
- Click the Formula
text box.
- In the Functions
list, double-click IF, then ISNULL.
- In the Fields
drop-down list, select Superstore.
- In the Fields list,
double-click Sales - Coffee Chain.
- Click outside the closing
parenthesis, space, type THEN 0 ELSE, and space again.
- In the Fields list,
double-click Sales - Coffee Chain.
- Add a space, and type END.
- Start a new line, and type
a plus sign.
- Start another new line, and
in the Functions list, double-click IF, ISNULL,
and then SUM.
- In the Fields list,
double-click Sales.
- Click outside the closing
parenthesis, space, type THEN 0 ELSE, and space again.
- In the Functions
list, double-click SUM.
- In the Fields list,
double-click Sales.
- Add a space, and type END.
|
|
Step 1
For Tableau Desktop version 7.0
and later, right-click the worksheet tab and select Duplicate Sheet.
For Tableau Desktop version 6.1 and earlier, select Edit > Duplicate
Sheet.
Step 2
From the Dimensions pane,
drag Measure Names to the Rows shelf.
Step 3
On the Rows shelf,
right-click Measure Names and select Show Quick Filter.
Step 4
In the Measure Names
quick filter, click the All check box to clear all the selections,
and then select Sales.
Step 5
From the Measures pane,
drag Measure Values to the Text shelf on the Marks
card.
A Measure Values shelf opens.
Step 6
From the Measures pane,
drag Sales - Coffee Chain and Total Sales to the Measure
Values shelf.
|
|


No comments:
Post a Comment